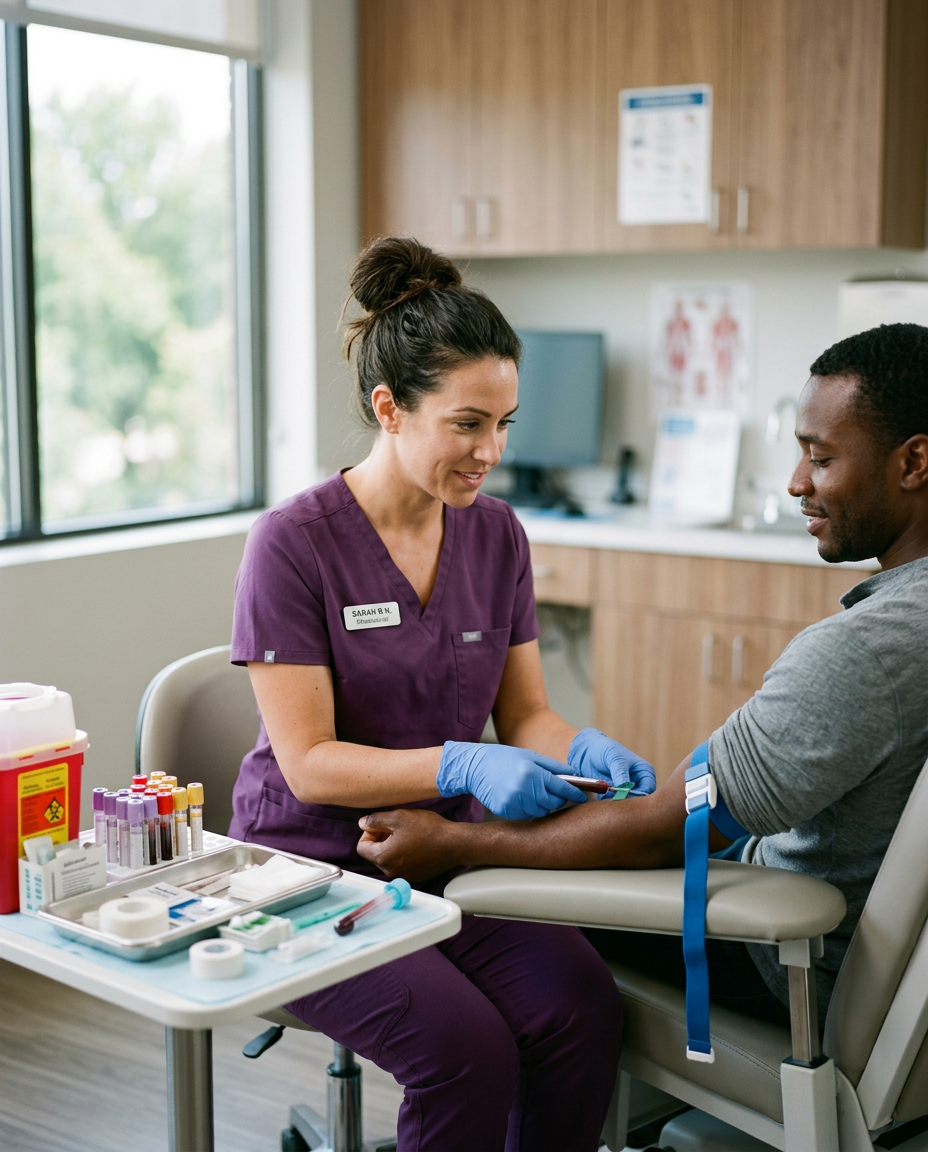
In a 2015 study published in Cell, 800 adults wore continuous glucose monitors for a week and ate some identical standardized meals. Blood sugar responses to the same food varied widely between people. Later research found similar variation, although how much is truly person-specific is still debated.
Most diet advice assumes a food does roughly the same thing to everyone. A bowl of oatmeal is "slow" carbohydrate. White bread is "fast." A 2015 study tested that assumption directly, and the results were messier than the food charts suggest.
What the 2015 study actually did
Researchers at Israel's Weizmann Institute of Science recruited 800 adults without diabetes. Each person wore a continuous glucose monitor (CGM) for a week, logged meals, sleep and activity in an app, and gave blood and stool samples. The team ended up with glucose responses to tens of thousands of real-life meals.
Each participant also ate a set of identical standardized meals, such as bread or glucose, first thing in the morning. That is the key part of the design. When everyone eats the same thing under similar conditions, differences in the response come from the person and the context, not the food.
The paper, published in Cell, reported high variability between people. A standardized meal that produced a small rise in one participant produced a large rise in another. In some pairs the pattern flipped for a different food.
Why would the same food act differently?
The study was not designed to prove causes, but it found that responses tracked with a mix of personal factors:
- Blood markers, including HbA1c
- Body measurements such as BMI and waist size
- Usual diet and the content of the meal itself
- Sleep and physical activity around the meal
- The makeup of the gut microbiome
The researchers fed these factors into a machine-learning model and found it predicted an individual's response better than carbohydrate or calorie counts alone. They then confirmed the model in a separate group of 100 people. In a small, short, blinded trial, diets chosen by the model lowered post-meal glucose responses compared with diets the model predicted would raise them.
What later research added
In 2020, the PREDICT 1 study in Nature Medicine measured responses to standardized meals in more than 1,000 adults in the UK, including many twins, plus a US group. It also found large differences between people in post-meal glucose, insulin and triglycerides.
Two findings stand out. Genetics explained only part of the variation, and even identical twins often responded differently to the same meal. Factors a person can change, such as meal composition, meal timing, sleep and activity, accounted for a meaningful share.
The picture is not settled. Some of the variation seen in these studies is ordinary day-to-day noise: the same person eating the same meal twice does not produce an identical curve. Researchers still disagree about how much of the difference between people is stable and person-specific, and how much the ranking of foods by glycemic index still holds for most individuals.
What a glucose monitor can and cannot tell you
A CGM is a small sensor worn on the arm that estimates glucose in the fluid under the skin every few minutes. In people with diabetes it is an established medical tool. In people without diabetes, the evidence is thinner.
What it can show is a personal pattern: which meals, portions and routines are followed by larger or longer rises. What it cannot show yet is that flattening those rises improves long-term health in someone whose glucose is already in the normal range. Trials on that question are limited.
A few practical cautions apply:
- Some rise after eating is normal physiology, not a problem to eliminate.
- Sensor readings lag behind and can differ from a fingerstick or lab value.
- A single odd reading means little. Patterns across days mean more.
- A glucose monitor does not replace lab testing such as HbA1c or fasting glucose.
Our longer guide to CGMs for people without diabetes goes through the evidence in more detail.
Habits that held up across studies
Personal variation does not erase the basics. Across this research, a few patterns were common to most people:
- Meals with more fiber, protein or fat alongside the carbohydrate tended to produce smaller rises.
- Sleep and activity on the day changed the response to the same meal.
- Light movement after eating was linked with a lower rise. We cover that in the post-meal walk.
These are observations from studies, not a personal plan. Anyone with diabetes, prediabetes or symptoms such as unusual thirst or fatigue should talk with a clinician before changing how they eat or treating numbers from a wearable as a diagnosis.
Measuring instead of guessing
The useful lesson from this research is modest. Averages are a starting point, and a person's own data can add to them. For most people that data starts with ordinary bloodwork such as fasting glucose, HbA1c and a lipid panel, read by a clinician who knows their history.
DirectCare AI offers clinician-ordered blood testing with results explained in plain English.
This article is educational and is not medical advice. Talk with a licensed clinician about your own health.
References
Real labs. Plain-English plan.
A clinician-ordered, 80+ biomarker panel. Results in 3–5 days, with a personalized roadmap from a US-licensed clinician — not a chart you have to decode yourself.
See my numbers →Editorial disclosure: This article is for informational purposes only and does not constitute medical advice. All treatments at DirectCare AI are prescribed by US-licensed clinicians based on individual medical evaluation. Compounded medications are not FDA-approved and are not reviewed by the FDA for safety, effectiveness, or quality. Always consult a US-licensed clinician before starting or changing any therapy.